Introducing Promexplorer: A Tool for Prometheus Metrics Navigation
As software developers, we’re constantly inundated with an immense quantity of data and metrics. The influx of information can sometimes be overwhelming, particularly when you need to sift through a multitude of metrics and labels. That’s precisely why I developed Promexplorer — a tool designed to simplify your interaction with Prometheus exporter feeds.
Simplifying Prometheus Metrics
Prometheus is a staple in the open-source community, recognized for its robust metrics collection and alerting system. It’s a powerful tool, but navigating some of the larger exporters can sometimes feel like traversing an intricate labyrinth.
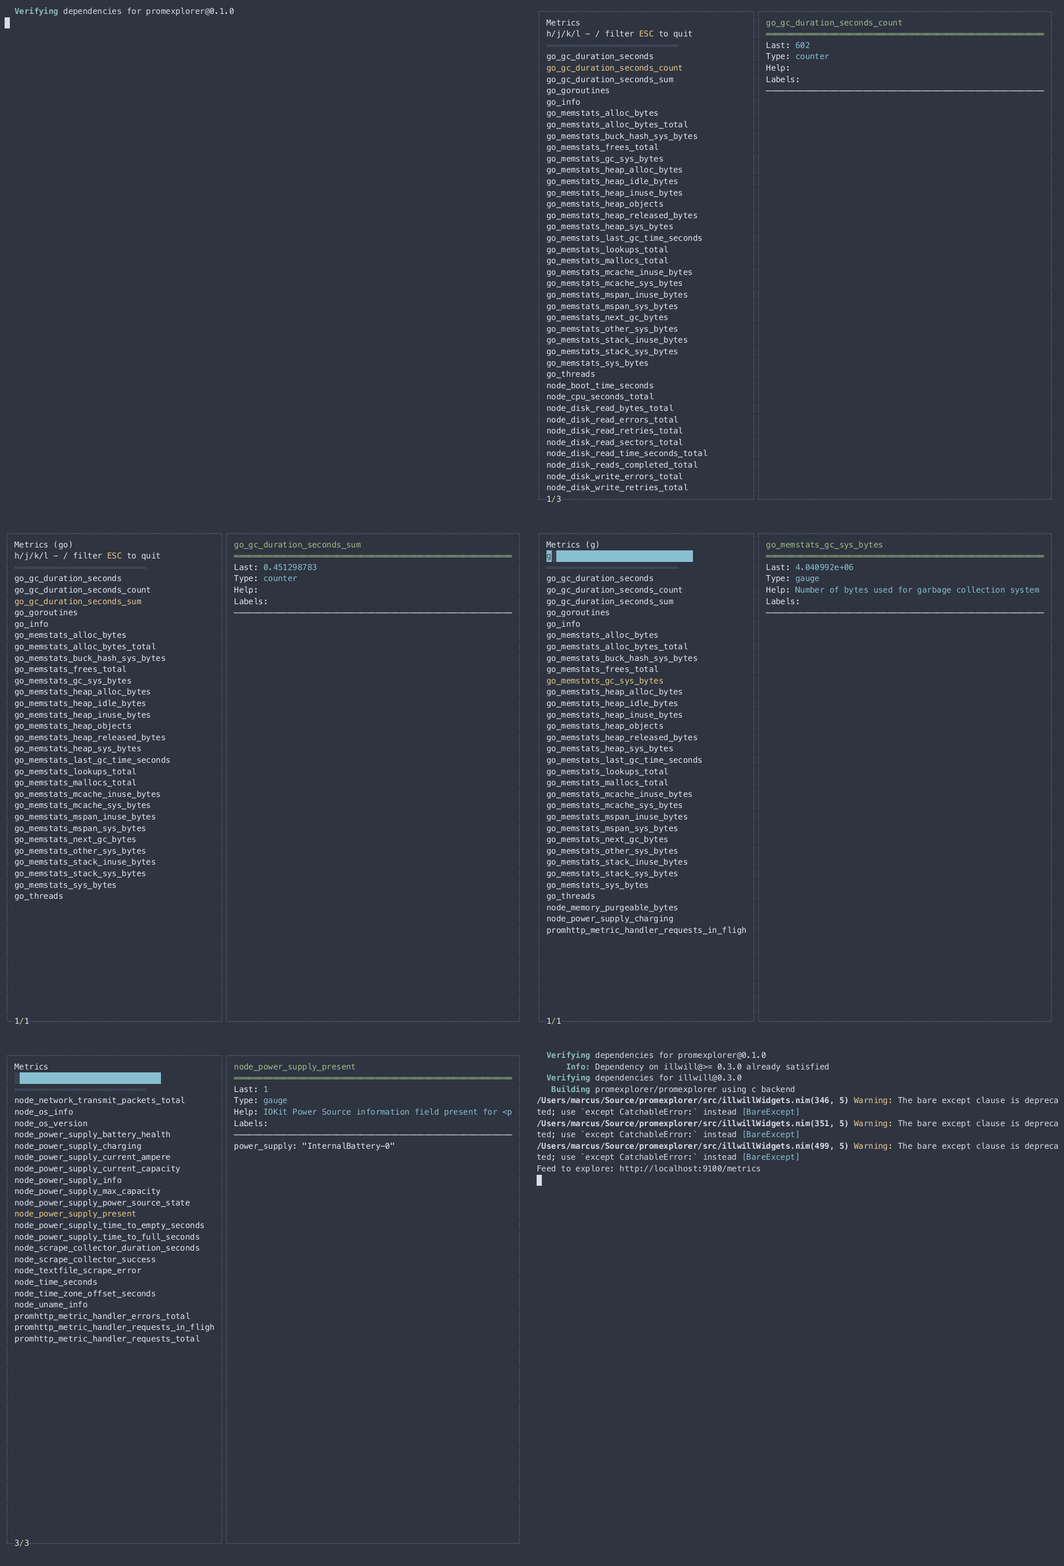
With Promexplorer, I wanted to offer a simpler way to manage this data. By aggregating all the labels into one metric, and allowing you to filter and navigate between pages, Promexplorer provides a straightforward text user interface (TUI) that allows you to navigate the available metrics seamlessly.
Quick and Easy Setup
Promexplorer aims to offer ease of installation alongside its simplicity of use. I’ve provided static binaries for macOS, Linux, and Windows. Simply download the appropriate binary from the latest release and place it in your PATH. It’s also available as a nix package.
The usage is equally uncomplicated:
❯ ./promexplorer http://localhost:9100/metrics
Just by running this command, you can explore your metrics in the TUI with ease.
in addition to http Promexplorer also supports https and file URLs,
Here’s a quick demo of Promexplorer, which illustrates the TUI navigation.

To get started, check out the Promexplorer repository. If you have any troubles please open a issue there.